When a standard app fails, you check the stack trace. But when an agent fails, you don’t know what to do. Is the model stuck in a recursive loop? Did it misunderstand the tool output? Is the “Critique Agent” currently hallucinating a list of reasons why the “Research Agent” is wrong?
You have no idea, because the logic isn’t in your code. It’s happening inside a black box in a data center thousands of miles away. The simplest fix is to add multiple print logging. But that quickly turns into a tangled mess of logging.
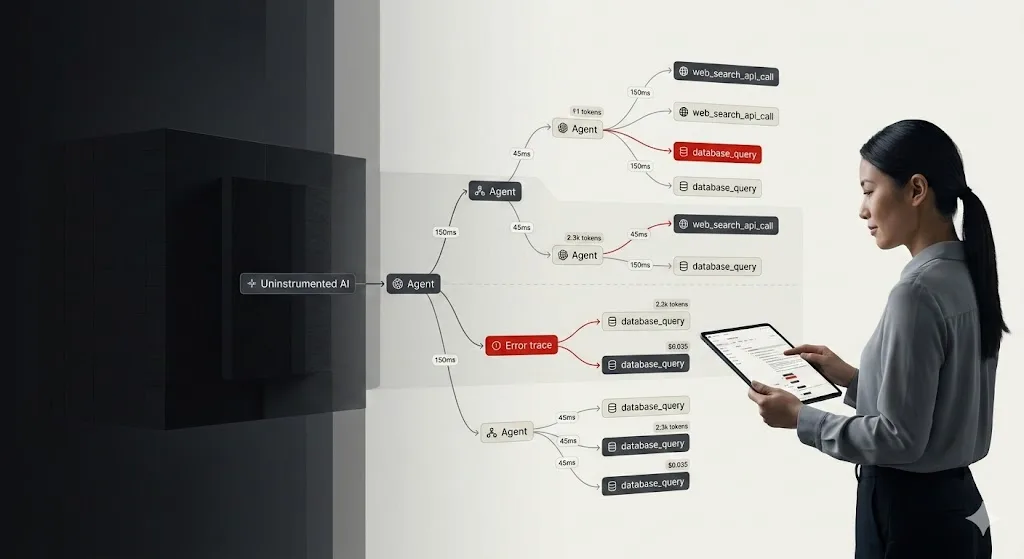
You print the final output of an agent, it looks okay, but you have no clue how it got there. Did it take five steps or fifty? Which tool failed? Why did the “Critique Agent” take 15 seconds to respond? Standard logging doesn’t work here because agents aren’t linear. They’re graphs, stateful, and messy. What we need is a dedicated tracing layer for every thought, tool call, and token spent.
Before we dive into the code, you need to decide where to send the logs and traces. If you want to set up self-hosting, the simplest way is to use Docker Compose to get the core stack running in minutes.
| Feature | Langfuse Cloud (Hobby) | Self-Hosted (OSS) |
| Effort | Zero. Just sign up. | High. Requires Setup. |
| Event Limit | 50k units/month (Free Tier). | Unlimited. Scaled by your hardware. |
| Data Privacy | SaaS. Hosted in the US or EU. | On-prem. Data never leaves your VPC. |
| Best For | Prototypes & Small Teams. | Large Scale & Compliance. |
Langchain LLM Observability With LangFuse: Installation Guidelines
This guide provides the exact steps needed to get production-grade observability running for your LangChain DeepAgents.
1. Configure the Environment
Depending on your choice above, set your LANGFUSE_HOST. If you are self-hosting, this will likely be your internal load balancer or domain.
import os

# --- PATH A: Langfuse Cloud (Free Tier) ---
# os.environ["LANGFUSE_HOST"] = "[https://cloud.langfuse.com](https://cloud.langfuse.com)" # EU Region
# os.environ["LANGFUSE_HOST"] = "[https://us.cloud.langfuse.com](https://us.cloud.langfuse.com)" # US Region

# --- PATH B: Self-Hosted (Big Scale) ---
# Replace with your actual deployment URL
os.environ["LANGFUSE_HOST"] = "https://langfuse.yourcompany.internal"

os.environ["LANGFUSE_PUBLIC_KEY"] = "pk-lf-..."
os.environ["LANGFUSE_SECRET_KEY"] = "sk-lf-..."
2. Scalable Self-Hosting
If you are going for “Big Scale,” do not just run a single container. Production-grade self-hosting requires the Langfuse v3 architecture (Postgres + ClickHouse + Redis).
For a scalable Docker Compose setup, you’ll want to ensure you allocate at least 4 CPUs and 16 GiB RAM to handle the ingestion worker and the ClickHouse OLAP database.
3. Initialize the Handler
You initialize the handler once, and it hooks into the LangChain execution lifecycle.
from langfuse.langchain import CallbackHandler

# Initialize the callback
langfuse_handler = CallbackHandler()
4. Basic Instrumentation
When you invoke your agent, you pass the handler into the config. Every sub-task and tool call gets piped directly to your dashboard.
from deepagents import create_deep_agent

# Define your agent
agent = create_deep_agent(
    tools=[internet_search],
    system_prompt="You are an expert researcher...",
)

# The critical part: adding the callback
result = agent.invoke(
    {"messages": [{"role": "user", "content": "What Zentara take on Zero Trust."}]},
    config={"callbacks": [langfuse_handler]}
)
5. Advanced: Multi-Agent Research & Critique
In a production environment, you rarely have one agent doing everything. You likely have a “Researcher” and a “Critique” agent working together. Tracing these nested interactions is where Langfuse shines.
# Sub-agent for focused research
research_sub_agent = {
    "name": "research-agent",
    "system_prompt": "Conduct thorough research on sub-topics.",
    "tools": [internet_search],
}

# Sub-agent for quality control
critique_sub_agent = {
    "name": "critique-agent",
    "system_prompt": "Identify missing details or logical gaps in reports.",
}

# Orchestrator
agent = create_deep_agent(
    tools=[internet_search],
    system_prompt="Lead editor: Use sub-agents to research and refine work.",
    subagents=[critique_sub_agent, research_sub_agent],
)

# Tracing captures the handoffs between sub-agents automatically
result = agent.invoke(
    {"messages": [{"role": "user", "content": "Analyze quantum computing's impact on RSA."}]},
    config={"callbacks": [langfuse_handler]}
)
6. Wrapping the Pipeline with @observe
Use the @observe() decorator to wrap custom logic outside of LangChain (like data cleaning or final API formatting).
from langfuse import observe

@observe()
def run_research_pipeline(user_query):
    # This entire function now shows up as a single parent trace
    return agent.invoke(
        {"messages": [{"role": "user", "content": user_query}]},
        config={"callbacks": [langfuse_handler]}
    )
Why Does LLM Observability Matter?
Once you have this running, the “black box” disappears. When a user complains that an agent is “slow,” or you see a spike in costs, you can open Langfuse and see exactly what happened:
- Latency: Did the search tool take 8 seconds, or was the LLM stalling?
- Cost: Did the critique agent use 4,000 tokens just to suggest a header change?
- Logic Errors: Did the agent skip the research step because the prompt was ambiguous?
Achieve Optimal LLM Observability With Zentara
At Zentara, we believe that complexity shouldn’t be a barrier to reliability.
Whether you’re managing a global overlay network or a fleet of autonomous AI agents, the principle is the same: you cannot secure or optimize what you cannot see.
Schedule a call today and protect your business with Zentara’s AI-powered Hybrid SOC and cloud security services.